Overview
Identification of genetic markers that manifest variations associated with risk of complex diseases remains one of the most challenging and important problems in human genetics. Linkage Disequilibrium mapping has proven a powerful tool for locating disease loci. Two loci are in Linkage Equilibrium if genotype frequencies at one locus are independent of genotype frequencies at the second locus, otherwise the two loci are in Linkage Disequilibrium (LD). Linkage Disequilibrium can arise from physical linkage, genetic drift, and selection on multilocus genotypes.
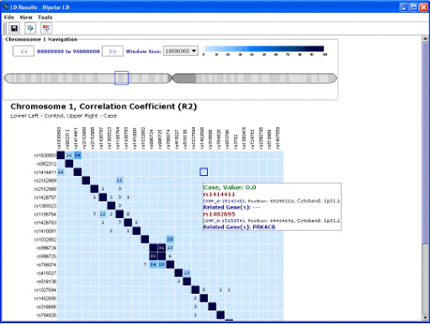
Exemplar computes Linkage Disequilibrium, D’ and Correlation Coefficient based on all SNP combinations from the input dataset that are on the same chromosome and within n bp’s of each other, where n is specified by the user. These calculations are done for cases and controls separately so comparisons can easily be made for divergence between the two groups |